 By Juraj · Last updated August 14, 2026
The whole test comes down to comparing two numbers the ECU already gives you: what it's asking the turbo for, and what the turbo actually delivers.
I earn from qualifying purchases and sometimes get tools for free (full disclosure). It never affects my scoring.
Used tools in this guide


Any full-system scanner with live-data graphing handles this test. I run it on my Mucar 892BT.
You don't need a €500 tablet for it either. A budget bidirectional scanner with a clean live-data graph does the job just as well, and the XTool A30M is the cheap one I'd point most people to for live-data work like this.
Video: How to test turbocharger with live data
This video shows how to compare turbocharger live data graphs.
Step-by-step procedure
Reading the graph
The names vary between cars and scanners, so look for these two:
| Value | What it means |
|---|---|
| Specified / target boost | What the ECU is requesting |
| Actual / measured boost | What the turbo is producing |
Common labels you'll run into: charge air pressure, boost pressure, intake manifold pressure. Some cars show kPa absolute, some bar or mbar. The unit doesn't matter for this test, only whether the two lines move together.
Connect the scanner, go into the engine module, open live data, and find both boost values. Display them on the same graph if the tool allows it. Then test in two phases.
Idle check. A small difference at idle is normal, actual can even sit slightly above specified. Ignore it. Idle tells you almost nothing about a turbo, the load isn't there yet.
Driving test. This is the one that matters. Do a few firm accelerations and watch how the two lines behave as the revs climb. A turbo only shows its weakness under load.
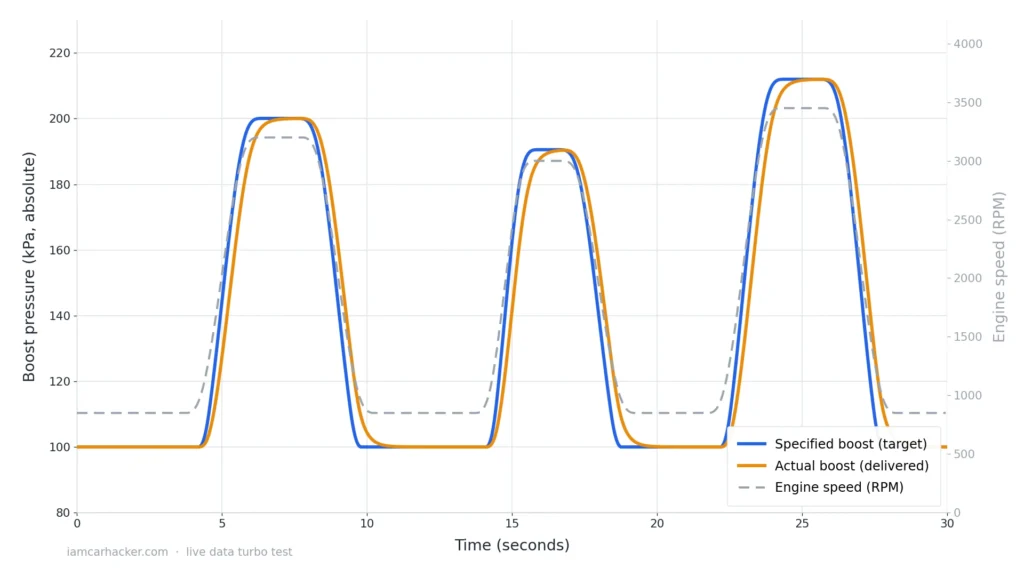
On a healthy turbo, actual boost follows specified closely on every pull. There's a small lag while the turbo spools, then it catches the target and holds it.
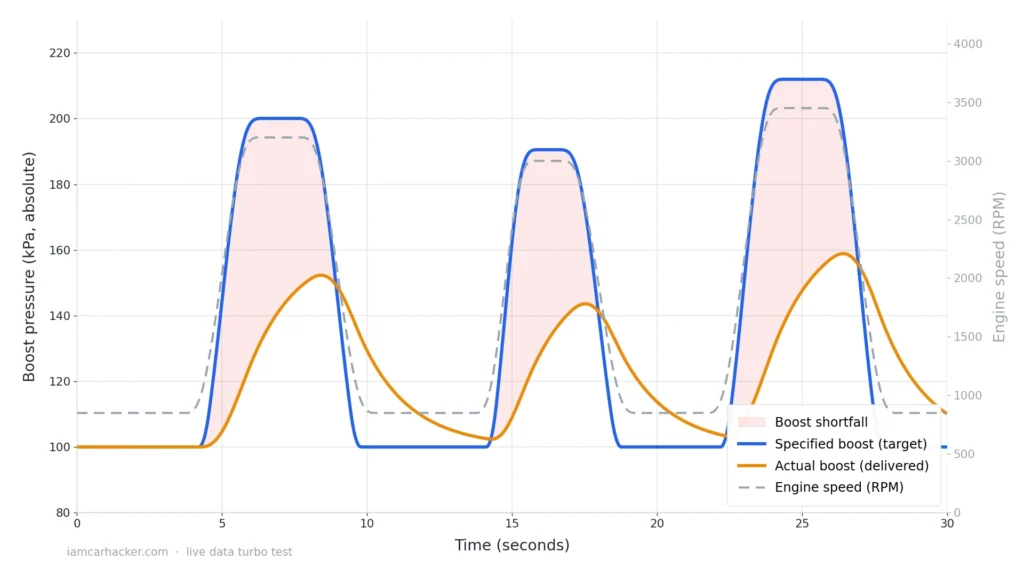
On a failing turbo, the lines split. Specified climbs as you accelerate, but actual builds slowly and never reaches it. That growing gap under load is the symptom.
What a boost shortfall actually tells you
Here's the honest limit of this test: it tells you the turbo isn't making target boost. It doesn't tell you which part is at fault. A shortfall like the one above usually comes from one of these:
- Boost leak, split hose, loose clamp, cracked intercooler or pipe
- Faulty turbo actuator or wastegate
- Vacuum or control issue
- A genuinely worn or failing turbo
Treat the graph as confirmation that something is wrong, then chase the cause. Most of the time it's a leak or an actuator, not the turbo itself, and that's the cheap end to check first.
When to run this test
It's at its best in three situations: checking a used car before you buy it, diagnosing a car that feels down on power, and verifying that a turbo or boost repair actually worked. In all three you get a clear yes or no in one short drive.
Legal & safety notice
More procedures like this
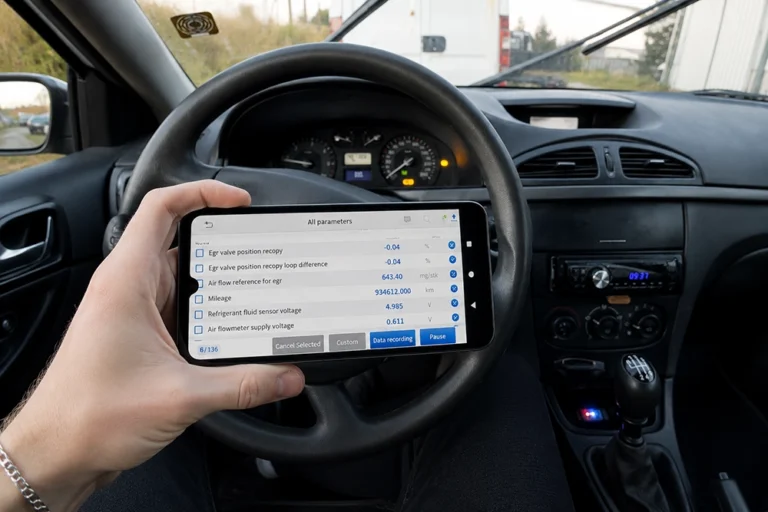
How to Check Real Car Mileage With an OBD2 Scanner
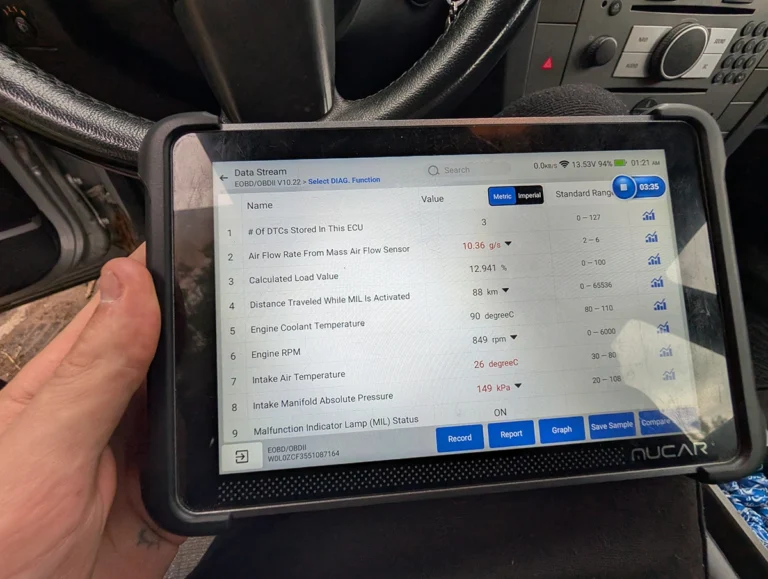
Opel Vectra C 2.2 DTI Limp Mode Fix: Stuck T-MAP Sensor Found With Live Data
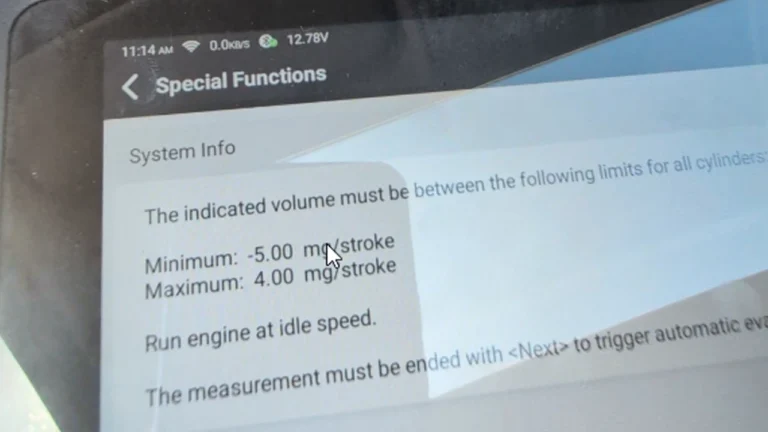
How to Check Fuel Injectors on BMW 5 Series E61 530d (2008) with OBD2 Scanner
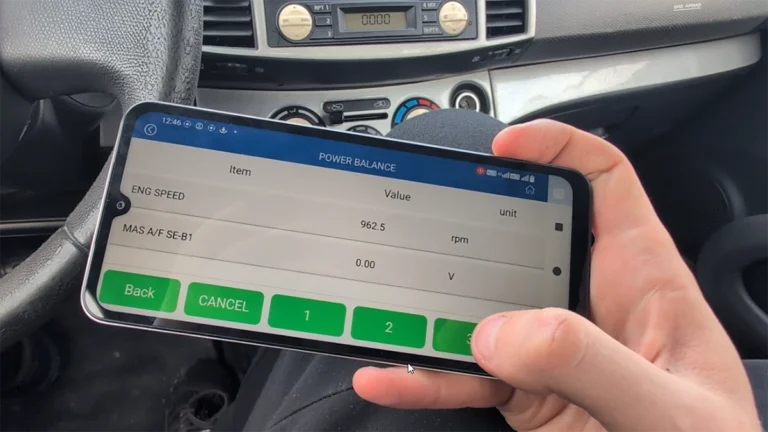
Nissan Micra K12 Power Balance Test with OBD2 Scanner
How to check diesel fuel injectors on BMW E46 using OBD2 scanner
How to Check Diesel Fuel Injectors (VW / Audi / Skoda / Seat) Using OBD2 Scanner
Most popular OBD2 guides




I'm Juraj Lukacko and I work as an auto electrician. On this site I share what I learn from real work on real cars, to help you pick the right tools for diagnostics, programming and tuning and get the job done.
More about me →